







Analytics before scaling up your business: what to check

TABLE OF CONTENTS
Profit.Store

76
When preparing a business for scaling up, owners usually assess budgets, the team and resources. At the same time, analytics is often overlooked, as it seems to be working already: advertising generates enquiries, the CRM system collects data, and reports allow results to be tracked.
In practice, it is at this stage that issues which previously had no bearing on decision-making become apparent. Some conversions are not captured by the analytics system; different platforms show different results, making it increasingly difficult to assess the true effectiveness of the channels. The larger the advertising budgets become, the more costly such inaccuracies prove to be.
Our partners at Solve Marketing regularly work with businesses that are reaching the scaling stage and face a common problem. Marketing is already generating more traffic and enquiries, but the system cannot cope with the load. Data is duplicated; the CRM shows one set of figures, the advertising dashboards show another, and the team is making decisions at random.
In this article, the Solve Marketing team will explore why scaling up without properly configured analytics often leads to scaling up mistakes. They'll also look at which processes and tools are worth checking before a business starts to grow faster.
Why analytics loses effectiveness when scaled up
The problem isn't with the tools — it's with the data collection architecture. Small businesses approach analytics on a "quick and good enough" basis: they set up Google Analytics, configure basic goals, and monitor conversions in their advertising dashboards. This works as long as traffic and the number of channels remain low.
When you zoom in or out, several things happen at once:
- The number of traffic channels is growing. In addition to organic traffic and one or two paid channels, affiliate programmes, retargeting, email, messenger and influencer traffic are now being added. Attribution is starting to break down.
- The volume of data exceeds the capabilities of Google Analytics. GA4 samples the data when volumes are high, and standard reports no longer reflect the true picture.
- The team is growing. New people are joining who need access to different data sets. The centralised dashboard in GA is no longer meeting everyone's needs.
- The decision-making cycle is speeding up. Whereas previously one might have had to wait a week for a manual report, real-time data is now required.
A typical scenario: a marketer checks Facebook Ads and sees an ROAS of 4.2. Google Analytics shows that twice as few transactions came from Facebook. The finance director checks the CRM and sees the third digit. Nobody knows which one is correct.
Module 1. Audit of current analytics prior to scaling
Before you start configuring anything, you need to understand what the current situation is and where the critical gaps lie.
What to check
1. Data quality in GA4
Open the "Traffic Sources" report and check the share of the (direct)/(none) channel. If it exceeds 15–20%, you have a problem with your UTM tagging or cross-device tracking.
A typical scenario prior to the audit:
| Channel | Sessions | Transactions | Income |
|---|---|---|---|
| google / cpc | 18 420 | 312 | $47 800 |
| (direct) / (none) | 11 230 | 187 | $28 400 |
| facebook / cpc | 4 210 | 41 | $6 100 |
| email / newsletter | 890 | 23 | $3 200 |
A direct share of 24% means that almost a quarter of transactions are not attributed correctly. As the system scales, this problem grows in proportion to the budget.
2. Data consistency across platforms
Compile the data from your advertising dashboards and GA4 for the same period into a single table. A discrepancy of more than 15–20% is a sign that further investigation is needed.
| Metric | Facebook Ads | Google Ads | GA4 |
|---|---|---|---|
| Clicks | 12 400 | 8 900 | — |
| Sessions from the channel | — | — | 9 200 / 6 100 |
| Conversions | 156 | 89 | 98 / 71 |
| Income | $24 800 | $14 200 | $15 600 / $11 300 |
If FB Ads shows 156 conversions and GA4 shows 71 from facebook/cpc, this isn't just a discrepancy between attribution models. Something is fundamentally broken here.
3. Event coverage in GTM
Go into GTM Preview Mode and walk through the key user scenarios: adding to the basket, starting the checkout process, and making a purchase. Check that all steps are firing events and that they have the correct parameters (value, currency, items).
4. The presence of a server-side tracking component
If you only use client-side tracking (via the browser), data loss will be significant as you scale up. Ad blockers, iOS 14.5+ restrictions and Safari ITP — taken together, these can "eat up" 20–40% of events.
Block 2. Data collection architecture for scalability
Switching to server-side tracking
Server-side tracking involves sending event data from your server directly to analytics platforms, bypassing the user's browser. This solves two key problems:
- The data is not blocked by ad blockers or browser restrictions.
- You control what data you send and where it goes, which is critical for GDPR/ePrivacy compliance.
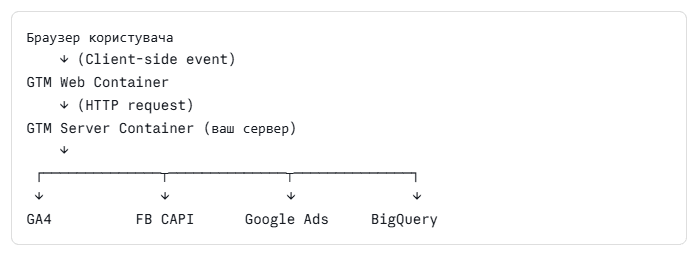
Rather than transmitting data directly from the browser to each advertising or analytics platform individually, modern approaches involve the use of an intermediate server-side data processing layer.
What are the benefits of switching to SST when scaling up:
- Recovery of 15–35% of "lost" conversions (depending on the audience and browsers).
- A single point of control over data.
- The ability to enrich events with server-side data (CRM data, custom parameters).
Configuring a UTM strategy
A common problem: every marketer sets UTM tags as they see fit. As a result, in GA, you end up with Facebook_Ads, facebook, FB, fb_paid — and they're all counted as different sources.
Scaling requires a single UTM standard, set out in a document and integrated into work processes.
Basic UTM structure:
| Parameter | Meaning | Example |
|---|---|---|
| utm_source | Platform | facebook, google, email |
| utm_medium | Traffic type | cost-per-click, cost-per-impression, email, organic |
| utm_campaign | Campaign title (template) | {year}{quarter}{product}_{target} |
| utm_content | Advertisement / version | video_01, banner_top |
| utm_term | Key query (for search) | buy_a_laptop |
An example of a correctly formatted URL:
https://example.com/product?utm_source=google&utm_medium=search&utm_campaign=2026_q2_laptop_sales&utm_content=responsive_ad_01&utm_term=gaming_laptop
Module 3. Centralised Data Warehouse
On a small scale, it's possible to manage with GA4 and compile reports manually. As the business grows, this becomes a bottleneck: data is scattered across 5–10 different platforms, synchronisation takes hours, and a single person is responsible for 'manual reconciliation'.
When is a data warehouse needed?
You need a centralised repository if:
- You have more than three marketing channels with substantial budgets.
- You want to compare CRM data with marketing expenditure.
- Your team needs different views of the same data.
- You are planning to more than double or triple your budget over the next six months.
BigQuery as a foundation
Google BigQuery is the de facto standard for companies scaling up in the e-commerce and digital sectors. GA4 offers native integration with BigQuery (free export of raw events), making this connection a logical starting point.
What you get as a result:
- A single source of truth for the whole team.
- The ability to create custom reports with arbitrary filters.
- SQL access to raw data without sampling.
- The ability to build ML models using your own data.
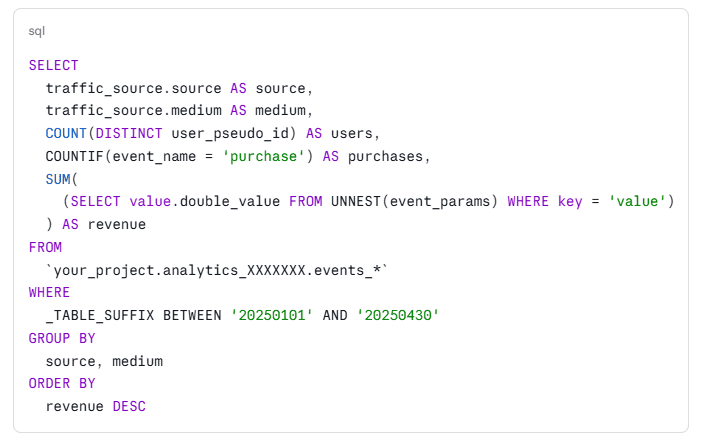
This query provides a true picture of revenue by channel based on raw data — without sampling and without GA attribution.
Module 4. Dashboards and Operational Analytics
The principle behind building dashboards for a scaling team
A common mistake made by many companies is to create a single, one-size-fits-all dashboard for all roles. Senior management, marketing, the sales department, and the product team all work with different solutions and require different levels of data detail. At the same time, all dashboards must be based on a single source of truth and updated automatically throughout the day, so that decisions are made based on up-to-date information.
Dashboard levels:
| Level | Audience | Update | Metrics |
|---|---|---|---|
| Executive | CEOs, CMOs, owners | Every hour | Revenue, ROMI, CAC, LTV, plan vs actual, forecast performance, lead quality based on scoring models |
| Marketing Ops | Head of Marketing, analyst, marketing specialist | Every hour | Channel-specific costs, LAC, CAC, ROAS, ROMI, conversions between funnel stages, lead scoring |
| Campaign Level | PPC Specialist, Media Buyer | Close to real time | CPA, LAC, ROAS, CTR, CPM, frequency, traffic quality, anomaly signals |
| Product | Product Manager, Sales Team, CRO | Every hour | Conversion rates by funnel stage, SQL, opportunity rate, retention, churn, revenue forecast |
It is particularly important for management to track not only marketing indicators but also business metrics: revenue and lead targets (Plan vs Fact), ROMI, revenue forecasts (Forecast Revenue), sales pipeline coverage (Pipeline Coverage), as well as the quality of leads generated using MQL and SQL scoring models. It is these metrics that enable an assessment of the business's readiness for further scaling.
Key metrics to track before scaling up
Unit economics:
- CAC (Customer Acquisition Cost) — separately for each channel.
- LTV (Lifetime Value) — preferably by cohort.
- LTV/CAC ratio — if it is less than 3:1, scaling will be unprofitable.
- Payback period — the number of months it takes to recoup the CAC.
Marketing metrics:
- ROAS by channel and campaign.
- LAC (Lead Acquisition Cost) for B2B or lead generation projects.
- Attributed revenue by channel (ideally, data-driven attribution).
Product metrics:
- Conversion by funnel stage (where the biggest drop-off occurs).
- 7/30/90-day retention rates for new users.
- AOV (Average Order Value) in progress.
Module 5. CRM analytics and the full data lifecycle
Why CRM data is critical when scaling up
GA4 tracks sessions and transactions. The CRM knows who these people are, what their value is, how much they've spent over the year, and whether they've returned after their first purchase.
Without linking your marketing data to your CRM, you'll be optimising for the first conversion and often acquiring customers who will never return.
A typical scenario: a Facebook campaign shows a CPA of $25 and an ROAS of 3.5. That seems pretty good. But the CRM data shows that 70% of customers from this campaign made just one purchase, and the 90-day retention rate is 8%. Meanwhile, the email channel has a CPA of $45, but the customers' LTV is twice as high.
What needs to be integrated:
- Transfer of Client ID / User ID between GA4 and CRM.
- Transfer of data on purchases, transactions, and offline conversions from the CRM to analytics systems via API integrations.
- Synchronisation of RFM segments with advertising audiences.
RFM analysis prior to scaling
RFM analysis (Recency, Frequency, Monetary) helps to assess the quality of the customer base and understand which segments generate the bulk of revenue. When scaling up, it is important to recognise their value to the business, as this is what influences the acceptable CAC and marketing investment.
| Segment | Specifications | A typical strategy |
|---|---|---|
| VIP customers | They shop frequently and spend large amounts | Retention, personalised offers, upselling |
| Regular customers | They return regularly and make consistent purchases | Loyalty schemes, cross-selling |
| New customers | Recently made their first purchase | Adaptation and encouraging repeat purchases |
| Promising | Show potential to become regular customers | Automated communications and personalisation |
| Risk zone | They used to buy a lot, but haven't been in touch for a long time | Win-back campaigns |
| Outflow | It's been a while since they last made a purchase | Reactivation or removal from active scenarios |
| One-off customers | Purchased once or several times without repeat cycles | Analysis of the reasons for and encouragement of repeat purchases |
When it comes to scaling up, it is important to understand how your customer base is broken down across these segments — this directly affects how much you can afford to spend on acquiring new customers.
Module 6. Technical checklist prior to scaling
Before increasing budgets or entering new markets, go through this checklist.
Data collection
- GA4 is configured with Enhanced Ecommerce (the "purchase", "add_to_cart" and "begin_checkout" events with the correct parameters).
- Server-side GTM has been configured or is due to be implemented.
- The Facebook Conversions API is set up and sends events in parallel with the pixel.
- The UTM strategy has been documented, and all campaigns have been labelled in accordance with it.
- The discrepancy in data between GA4 and advertising platforms is less than 15 per cent.
Storage and processing
- GA4 export to BigQuery (or an alternative data store) has been set up.
- CRM data is integrated, or there are plans to integrate it.
- Advertising account expenditure is imported into the repository (either manually or via the API).
Reporting
- A built-in Executive dashboard featuring key business metrics (Revenue, Plan vs Fact Revenue, Plan vs Fact Leads, ROMI, CAC, LTV, Forecast Revenue, Pipeline Coverage, MQL Score, SQL Score).
- There are separate operational dashboards for marketing.
- Baseline values (benchmarks) have been established for all key metrics.
Unit economics
- The CAC is calculated for each channel.
- Calculated LTV (based on at least a 90-day window).
- LTV/CAC > 3:1, at least for the main channels you plan to scale.
- Known payback period.
Common mistakes when preparing analytics for scaling
1. "We'll set up the analytics when we need them"
By then, you will have already lost months of historical data. Setting up analytics is always an investment in future decisions, not current ones.
2. Optimisation for the first conversion, without taking LTV into account
The channel with the highest conversion rate is rarely the most profitable in the long term. Scaling without LTV data means optimising based on the wrong metric.
3. Fragmented data with no single source of truth
If different departments are using different figures, no management decision can be made with confidence. Before scaling up, the whole team needs a single 'truth'.
4. Ignoring server-side tracking
In 2025, customer tracking results in significant data loss. This is particularly critical when expanding into international markets with stricter privacy regulations.
5. Lack of alerts and anomaly monitoring
As budgets increase, the cost of error rises proportionally. Set up automatic alerts for critical metric deviations — a drop in conversion rates, a spike in CPA, or abnormal traffic.
How an analytics audit impacts scaling: the Solve Marketing case study
During an audit of the client's advertising analytics, the Solve Marketing team identified several issues that could have a significant impact on the effectiveness of scaling.
The Google Ads campaigns were structured correctly, and Performance Max delivered significantly better results than classic search. Over the last 30 days:
- The search campaigns generated 23 conversions with a CPA of 1,500.35 UAH, at a cost of 34,508.04 UAH;
- Performance Max — 496 conversions at a CPA of 60.59 UAH, with a spend of 30,058.62 UAH.
Despite this, budgets were allocated inefficiently across the campaigns.
The audit also revealed a problem with optimisation based on incorrect signals. One of the main conversions was a click on a phone number. Between 1 July and 21 August, the system recorded 1,421 clicks, but there were fewer than 100 actual calls. As a result, the algorithms optimised the adverts for actions that did not generate genuine leads.
Meta Ads also found:
- the absence of dynamic UTM tags;
- an overloaded campaign structure;
- incorrect retargeting;
- an insufficient budget for a large number of ad groups and creatives.
As a result, the team was unable to pinpoint exactly which campaigns, audiences and adverts were generating high-quality leads.
This case study clearly illustrates a typical scaling problem. Even when ad campaigns are performing well, errors in analytics and attribution can distort the data and hinder the effective scaling of budgets.
Things to bear in mind
Scaling a business without solid analytics is like making strategic decisions blindfolded. You increase budgets without knowing exactly what works and why. You hire people, but lack the infrastructure for them to work with the data. You enter new channels without understanding the basic performance metrics.
A practical step-by-step guide:
- An audit of the current state of analytics, where data is lost or distorted.
- Resolving critical issues with data collection (UTM, conversions, server-side).
- Setting up a centralised repository to serve as a single source of truth.
- Building operational dashboards for the team.
- Calculating unit economics and setting benchmarks.
Scalable analytics provides answers to the questions: where should the next dollar of the budget be invested, and why there in particular?
For companies that are in the growth phase or planning to scale up, the Solve Marketing team offers a free marketing consultation. During this consultation, we assess your current analytics system, identify areas of data loss and prioritise the issues that directly impact the effectiveness of your marketing and your ability to scale.
SHARE

OTHER ARTICLES BY THIS AUTHOR
Get the most exciting news first!
Expert articles, interviews with entrepreneurs and CEOs, research, analytics, and service reviews: be up to date with business and technology news and trends. Subscribe to the newsletter!
By clicking “Subscribe” you agree to Privacy Policy and consent using your contact data for newsletter purposes
OR FOLLOW ON: