


Case: End-to-End Analytics for TOP Superfoods
TABLE OF CONTENTS
Profit.Store

21
Case: End-to-end analytics for TOP Superfoods
TOP Superfoods is a Ukrainian brand specializing in natural superfoods, including spirulina and chlorella sourced from Lake Chenghai (China). The company positions itself as a supplier of high-quality microalgae for health and energy, with over 60 thousand customers. The main type of activity is non-specialized wholesale trade.
TOP Superfoods has a large volume of advertising traffic and advertising campaigns across multiple channels. The main sources of customer acquisition are Facebook Ads, Google Ads, and TikTok Ads. The company uses KeyCRM to process orders and sales.
Challenge: Data chaos and lack of a holistic picture
When TOP Superfoods contacted us, their analytics looked like this:
- 10+ Excel spreadsheets
- Data was collected manually daily or weekly
- A lot of time was spent preparing reports
- High risk of errors due to human error
The company could not:
- see real efficiency, ad groups, and campaigns
- understand which sources actually bring profit
- make decisions quickly based on data
Key business objective
The client wanted:
- Combine costs from advertising accounts (Facebook, Google, TikTok)
- Combine them with actual sales from KeyCRM
- Get analytics for each creative, ad group, and campaign
- Automate the process without manual collection
Main difficulty: delayed purchases
A feature of TOP Superfoods is a long customer decision cycle. A typical scenario looks like this: a user visits the website from an advertisement, their UTM tags are stored in cookies, but the purchase occurs a few days or even a week after this event.
This creates a problem: at the time of purchase, the advertising campaign may already be disabled, and its data may have been changed or made unavailable. Therefore, it is difficult to correlate the UTM tag with costs, and it is impossible to calculate ROI correctly.
Our solution
1. The correct logic for defining "lead date"
Most companies calculate the lead date based on the creation of the request or the purchase. But actual lead date = the user's first visit to the website. Therefore, we implemented the following approach: we preserved the original UTM tags, recorded the date of the first event, and tied all subsequent actions to this date.
As a result, the client received correct attribution, a real understanding of advertising effectiveness, and a more accurate ROAS.
2. Building end-to-end analytics
We have integrated advertising channel spending, lead data, and actual sales from KeyCRM into a single system. So now the client can see the profit for each creative, campaign performance, and real ROMI.
3. Transfer of real payments to advertising accounts (CAPI)
Previously, algorithms were optimized for form completion or basic purchases. We configured payments to be transferred to advertising accounts using the CAPI method. This resulted in more accurate targeting, fewer untargeted leads, and higher-quality traffic.
Based on the client's references in the "non-design" tool, we created a high-quality interface design that presents complex data simply, helps you quickly find insights, and avoids overloading the user.
The head of marketing received a real-time dashboard that allows him to monitor plan-to-fact daily, view KPI performance, and promptly influence results.
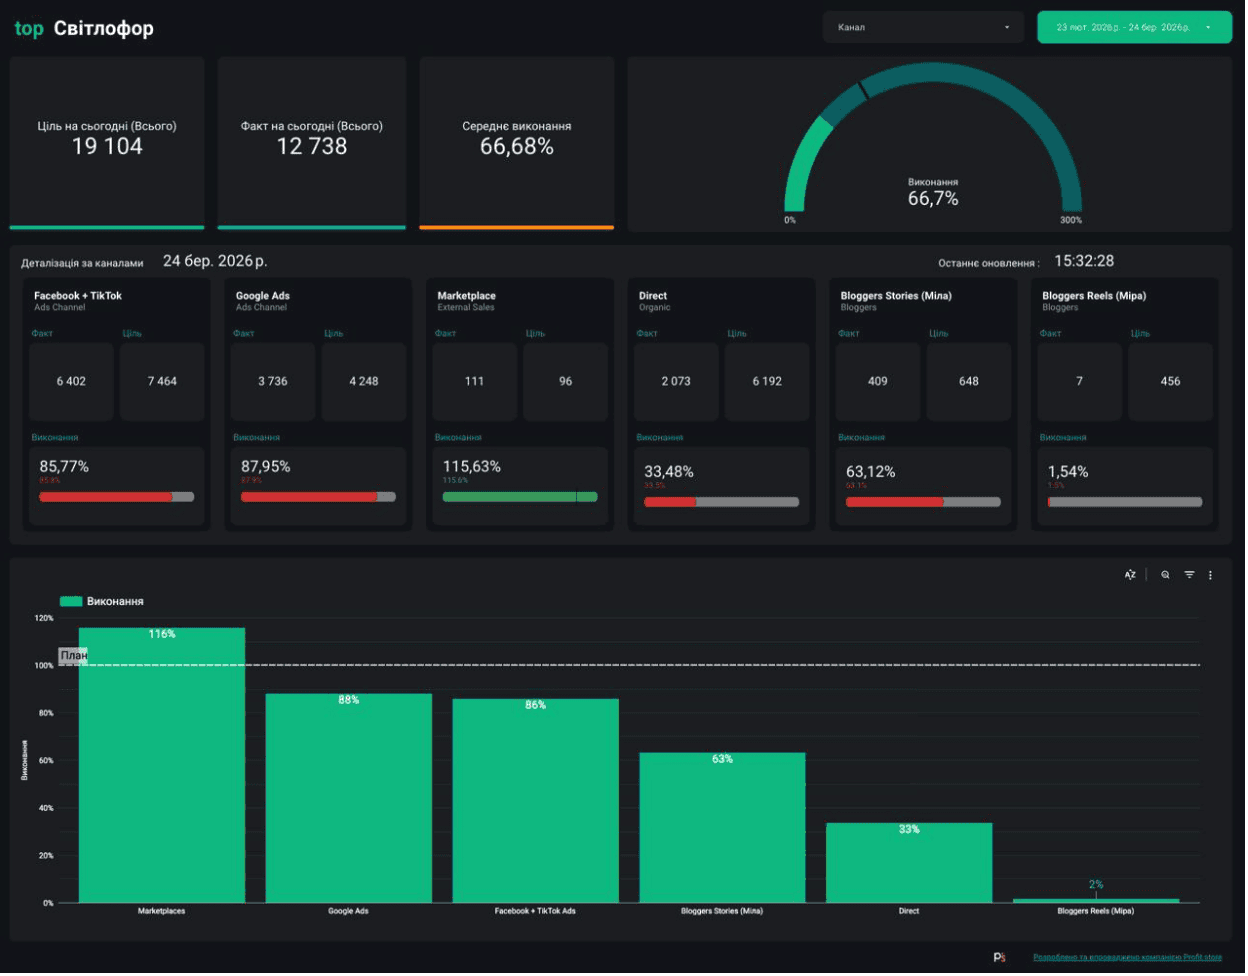
During the project implementation, we created a custom solution—marketing channel performance dashboard—so that the CMO can understand the state of marketing at a glance and react quickly, rather than waiting for reports at the end of the day or week. "Traffic light" shows the execution of the sales plan/results by channel. Each block shows the fact, the goal, and the completion percentage.
This dashboard is a tool for quickly monitoring and analyzing the effectiveness of marketing channels in real time.
It is needed in order to:
- see how the business is moving relative to the plan throughout the day
- understand which channels work well and which don't
- make decisions quickly: where to increase activity and where to change something
What can be understood from it:
- The general situation: whether the plan is being implemented normally, or if there is a backlog
- Channel balance: which sources give the main result
- Problem areas: where efficiency is low and needs attention
- Comparing channels with each other: what works better/worse
- Dynamics throughout the day: how the situation changes at the moment
How we find "lost" UTM tags from TikTok
The next challenge was that the UTM tags in the client's system were inserted incorrectly; some of them were lost, and the API could not process them correctly. This was especially critical for TikTok (via the built-in browser).
TikTok has become one of the most powerful channels for e-commerce due to its ability to quickly generate demand through short, emotional, and viral content. This is especially important for TOP Superfoods, as the platform is ideal for promoting health, energy, and daily habits—the very things that underpin products like spirulina and chlorella. Through TikTok, the company can increase awareness among new audiences and demonstrate the real benefits of its products, build trust, and encourage impulse purchases.
Therefore, wasting UTM tags is not just a technical detail but a systemic problem for the client and e-commerce in general, which directly affects the quality of decision-making and the effectiveness of marketing investments.
First, even under normal conditions, analytics is never complete: a good attribution rate is ~70%+, meaning up to 30% of conversions are already "lost" due to technical limitations, cookie consent, or device changes. This is basic "noise" without taking into account errors in the UTM itself.
Secondly, the actual loss is often much greater due to technical factors:
- Up to 42.7% of users use AdBlock/private browsers, which can completely remove UTM parameters or block their reading
- Redirects (HTTP→HTTPS, www/non-www) can completely "cut off" UTM, causing massive traffic to go to "direct"
- Various technical errors with UTM occur in about 90% of marketing teams
Ultimately, this means that a significant portion of traffic and sales:
- or not attributed at all (goes to "direct/none"),
- or is attributed incorrectly (distorts channel effectiveness).
This information is critical for e-commerce because UTM is the "bridge" between advertising spend and real revenue. When this bridge breaks, a business is effectively optimizing marketing "blindly."
In the context of TOP Superfoods, this means that without UTM quality control:
- TikTok and other channels may be underestimated (part of the sales will go to "direct"),
- Campaigns' ROI will look worse than it actually is,
- Decisions to scale up or down channels will be potentially wrong.
Our solution
The problem is solved by standardizing UTM tag transmission, moving them to separate parameters, and adding backup fields to save tags. If a tag is overwritten, the system takes it from the backup parameters.
The client currently has a million-dollar turnover and significant advertising investments, indicating a real contribution from the channel even at this stage. At the same time, if we focus on market benchmarks (1–3% conversion for e-commerce) and TikTok shows indicators close to or above these values, this is a strong signal: the channel is already performing at or above market level, even without full data transparency.
Sales dashboards
At the client's request, we divided the sales report into 4 similar dashboards—by sales type (wholesale/retail) and by users (manager/managers).
The most attention was paid to retail dashboards:
- Adapted "conversion" under the logic of taking into account the customer's order.
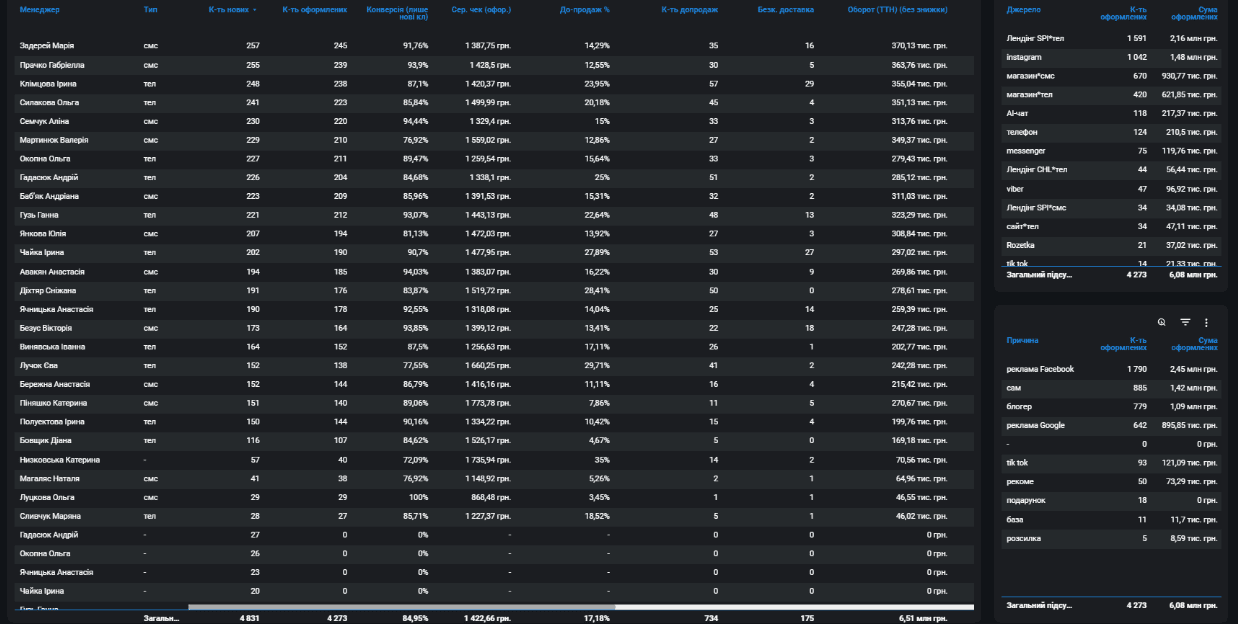
- Added separation of managers by communication direction. CRM does not provide such information, so we created a table in Google Sheets. In it, the client, using a provided template, fills in information about managers, which automatically enters the database, where it is combined with the main data and sent to the dashboard.
- Implemented the display of the indicator "number of orders per hour" to see the workload of each manager. At first, there was no available source from which we could get this information. Therefore, we introduced another table in Google Sheets, where the client records the working hours of managers, and the data also automatically enters the dashboard.
- Implemented the indicator "Repeat customers" to understand how many TOP Superfoods customers reorder products. To place this indicator in a general table, along with other metrics, we wrote separate code to transfer data from the database to Looker Studio (now Data Studio).
Sales dashboards allow you to:
- The manager can see the overall picture of the effectiveness of managers and the success of products
- Leaders and managers need to understand popular trends and preferred types of customers (new/regular)
- Managers should monitor their own activity and engage in healthy competition
On the dashboard, you can see:
- Order conversion: Are leads being processed effectively to convert into customers?
- Customer satisfaction: What proportion of customers become regulars?
- Managers' effectiveness. Which manager brought in the most clients, and which one needs to improve their engagement?
- Reasons for losing customers. What are the reasons for losing the most leads and potential customers?
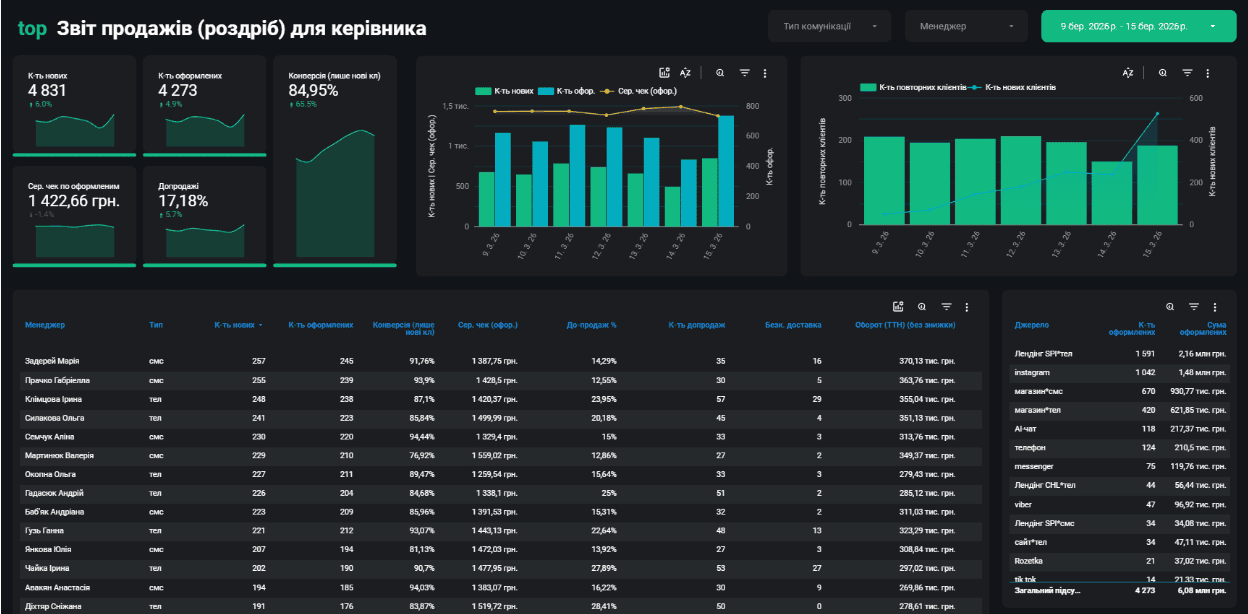 Sales Dashboard (Retail) for Manager Part 1
 Sales Dashboard (Retail) for Manager Part 2
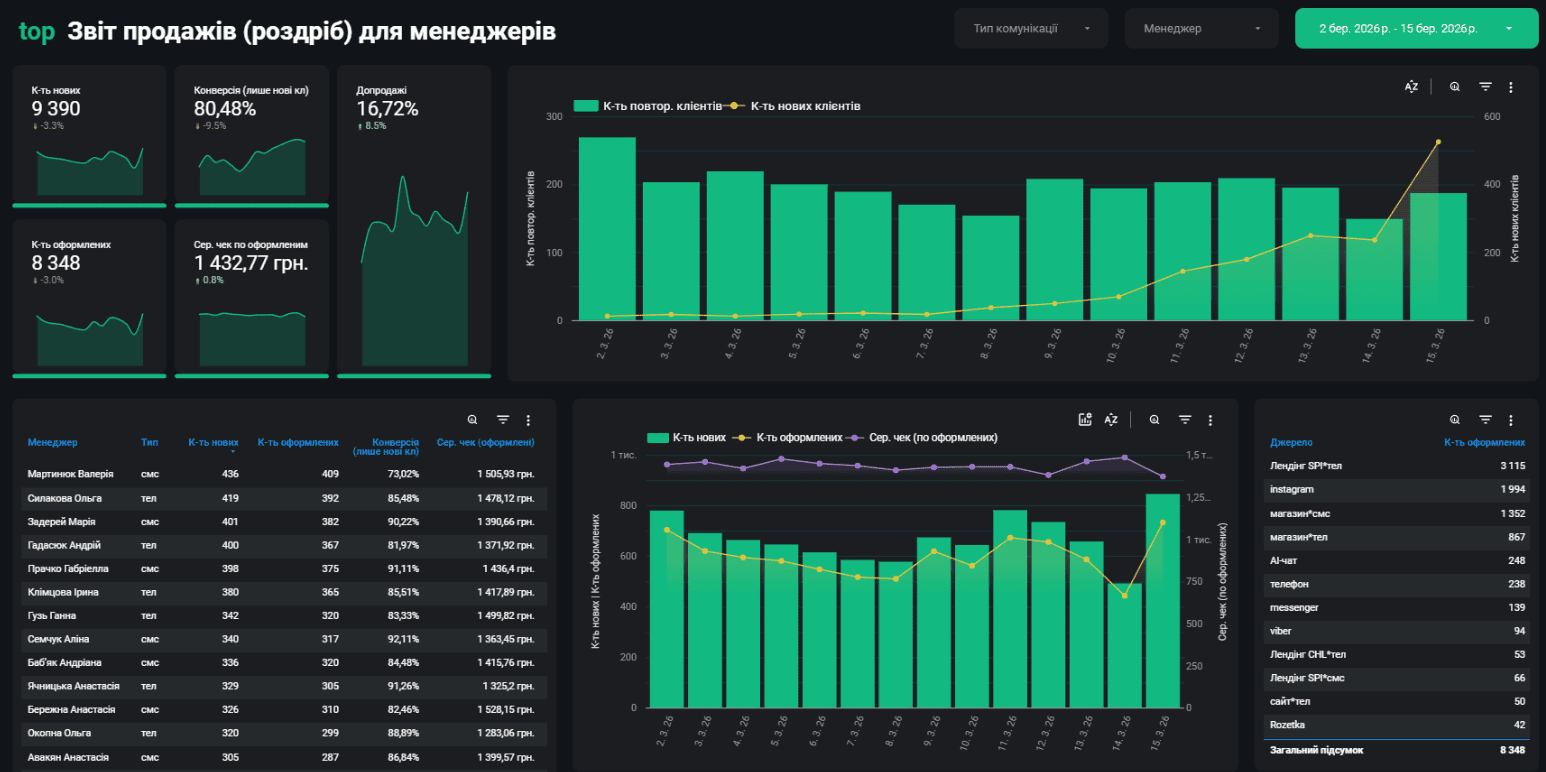 Sales Dashboard (Retail) for Managers Part 1
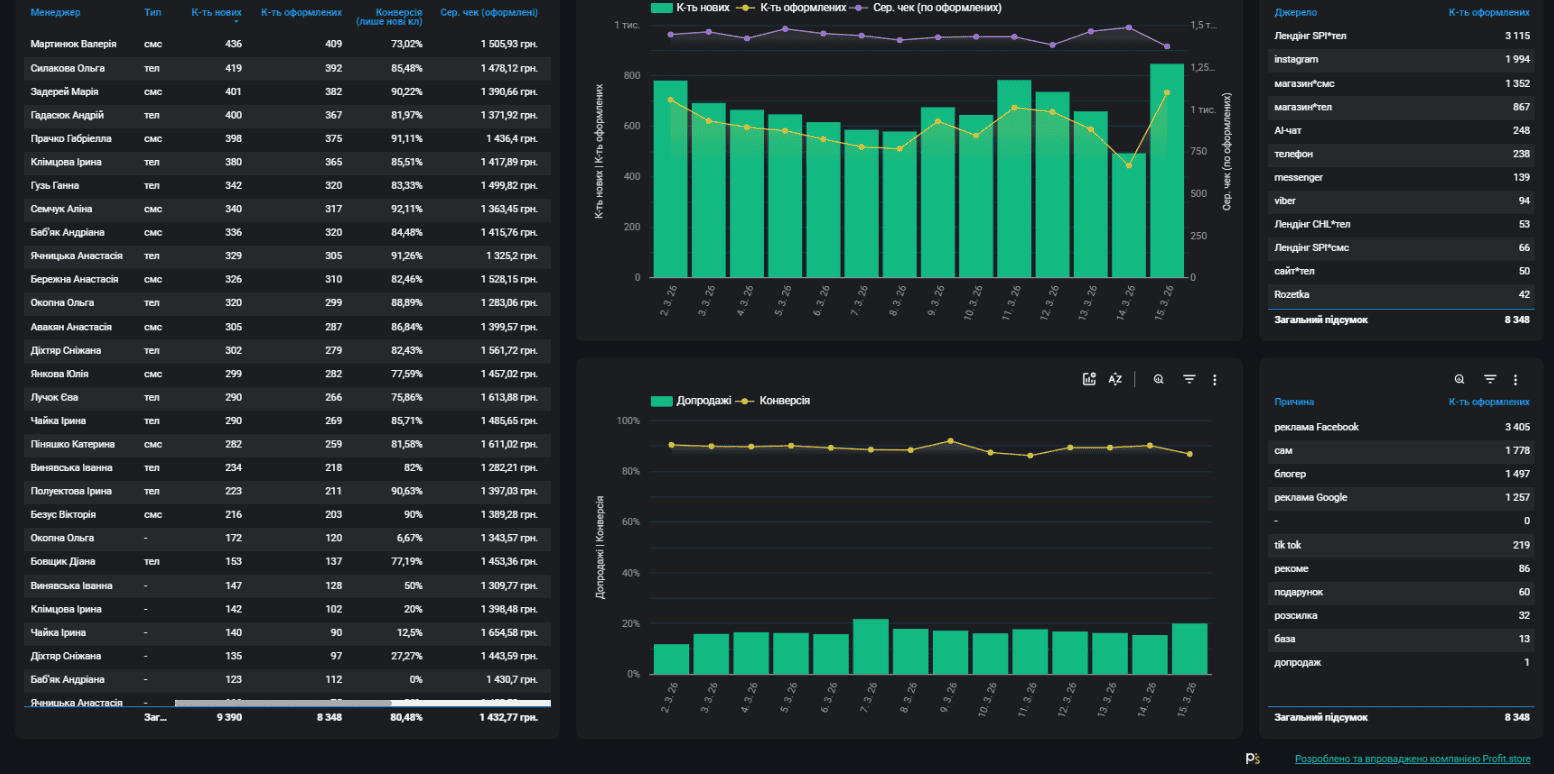 Sales Dashboard (Retail) for Managers Part 2
How we build end-to-end analytics
Our methodology consists of 3 stages:
1. Data mining
- collection of all data sources
- construction of animal boards
- correctness check
2. Logic model
- creating an analytics structure
- linking all data
- construction of metrics
3. Optimization stage
- making edits
- adaptation to business
- improving accuracy
Results for TOP Superfoods
After implementation:
- No more Excel spreadsheets — no more manual data entry required, saving dozens of hours every month.
- Deeper analytics — data for each creative, drill down to the campaign and group level.
- Lack of human factor — process automation, error minimization.
- Precise marketing solutions — understanding what really brings profit, more efficient use of the budget.
Conclusion
This case shows that with a large number of advertising campaigns, standard analytics no longer works.
Without an end-to-end business system:
- loses data
- misjudges advertising
- makes ineffective decisions
After implementing end-to-end analytics:
- data becomes transparent
- marketing becomes managed
- profit becomes forecasted
SHARE

OTHER ARTICLES BY THIS AUTHOR
Get the most exciting news first!
Expert articles, interviews with entrepreneurs and CEOs, research, analytics, and service reviews: be up to date with business and technology news and trends. Subscribe to the newsletter!
By clicking “Subscribe” you agree to Privacy Policy and consent using your contact data for newsletter purposes
OR FOLLOW ON:
