


End-to-end analytics for 2Control

TABLE OF CONTENTS
Profit.Store

127
How 2Control increased marketing efficiency by 25% thanks to ProfitStore end-to-end analytics and KeyCRM
Many small and medium-sized business owners still try to rely on intuition, Excel spreadsheets, and managers’ memories. At the initial stage, this works: the owner knows customers by name, remembers all deals, and can quickly respond to problems. But as the company grows and the product line and customer base increase, manual accounting becomes impossible. Information gets lost, communication becomes chaotic, and decision-making turns into a lottery.
That is why more and more companies are switching to data-driven management, using CRM systems and end-to-end analytics. These tools allow you to:
- see the full picture of the business;
- monitor marketing effectiveness;
- identify weaknesses and growth points;
- Make decisions based on data, not intuition.
This case study tells how 2Control, a Ukrainian company selling transport equipment and providing GPS services, went from manual accounting to fully automated analytics, increasing marketing efficiency by 25% and saving about 4,000 hours per year creating and compiling manual reports.
About 2Control
2Control is a company specializing in transport security and automation systems. It offers comprehensive solutions combining hardware, software, and service.
Products and services
- Equipment: DVRs, surveillance cameras, GPS trackers, and telematics systems.
- Software: systems for fleet monitoring and transport control.
- Services: equipment installation, technical support, and GPS monitoring subscription services.
Target audience
The company's clients are agricultural enterprises, logistics operators, carriers, and dispatching services. For them, the following factors are critically important:
- transport control;
- fuel economy;
- driver safety;
- transparency of fleet management processes.
One of the features of 2Control's business is a long and multi-level sales cycle. The client goes through several stages:
- Consultations and preliminary calculations
- Hardware and software demonstration
- Budget and terms agreement
- Equipment installation 5 Connecting to a subscription GPS monitoring service
- Technical support and maintenance
Therefore, to control the entire process, accurate data is needed at every stage of the funnel.
Initial state: chaotic accounting and manual processes
At the start, the company used Excel, email, and manual transaction control. On small volumes, this worked:
- The owner remembered customers by name.
- Knowledge of customer needs allowed for quick decisions.
- Sales and support were carried out without formalized processes.
However, as the company grew, problems began to mount:
- Data was duplicated or lost, which led to errors in billing and monitoring of subscription fees. 2 Tracking the status of deals became impossible — managers did not always know at what stage the client was.
- Marketing has lost transparency — it was impossible to quickly assess the effectiveness of the channels.
- The team spent a lot of time on routine, which reduced time for strategic tasks.
The result: the owner and team spent hours collecting data instead of developing the business, and the effectiveness of marketing budgets remained invisible.
First attempts at automation
To solve the problem, the company started with a self-recording system. It helped partially but had serious drawbacks:
- High dependence on developers;
- Difficulty in maintenance and scaling;
- Lack of integrations with other services;
- Inability to obtain an analytical picture of the business.
The company then tested CRM systems, including Bitrix. They were either difficult to implement or did not meet the specifics of the processes.
After the full-scale invasion began, priority was given to Ukrainian products that could be quickly adapted to the local market.
CRM choice: KeyCRM
The company has identified key criteria:
- Rapid implementation without stopping business processes;
- Convenient communication with customers via Viber and Telegram;
- Intuitive interface for managers;
- Possibility of integrations and scaling;
- Reasonable price.
KeyCRM met all the criteria. The implementation took only a week: transferring contacts, setting up business processes, and connecting communication channels.
CRM gave the team orders in sales and control of transactions and payments, but the problem of analytics remained.
Problems without end-to-end analytics
Even with CRM, there were many unresolved issues:
- Which advertising channels really work?
- Which products have the highest margins?
- How do changes in marketing affect sales?
- Where is the company losing leads and budget?
The data was scattered between:
- advertising offices;
- Google Analytics;
- telephony;
- CRM;
- Google Sheets.
To get a picture of the business, data had to be collected manually. This was time-consuming and did not allow for quick management decisions.
Implementing end-to-end analytics
To close these gaps, 2Control turned to ProfitStore. The goal was to create a system that shows the complete customer journey from first contact to payment and allows you to analyze the effectiveness of marketing investments.
Implementation stages
- Audit of business processes and data sources;
- Integration of advertising channels, telephony, Google Sheets, and CRM;
- Building dashboards with key metrics;
- Data validation;
- Training the team to work with analytics.
KeyCRM's special role is to capture the final part of the sales funnel. Without accurate CRM data, the analyst could not work.
Details of working with end-to-end analytics
After integrating end-to-end analytics, the company gained a single dashboard, where you can see the entire customer interaction cycle. Previously, data was collected manually from various sources:
- number of calls from managers to ATC;
- results of advertising campaigns on Facebook, Google Ads, and other platforms;
- CRM data about leads, deals, and payments;
- Google Sheets with intermediate indicators.
Additionally, building a complete picture used to take days and involve multiple employees. Now it all comes down to an automatic dashboard update, where, in real time, the following are displayed:
- number of leads by channels;
- conversion from lead to sale;
- the effectiveness of managers;
- the impact of changes in the advertising campaign on sales.
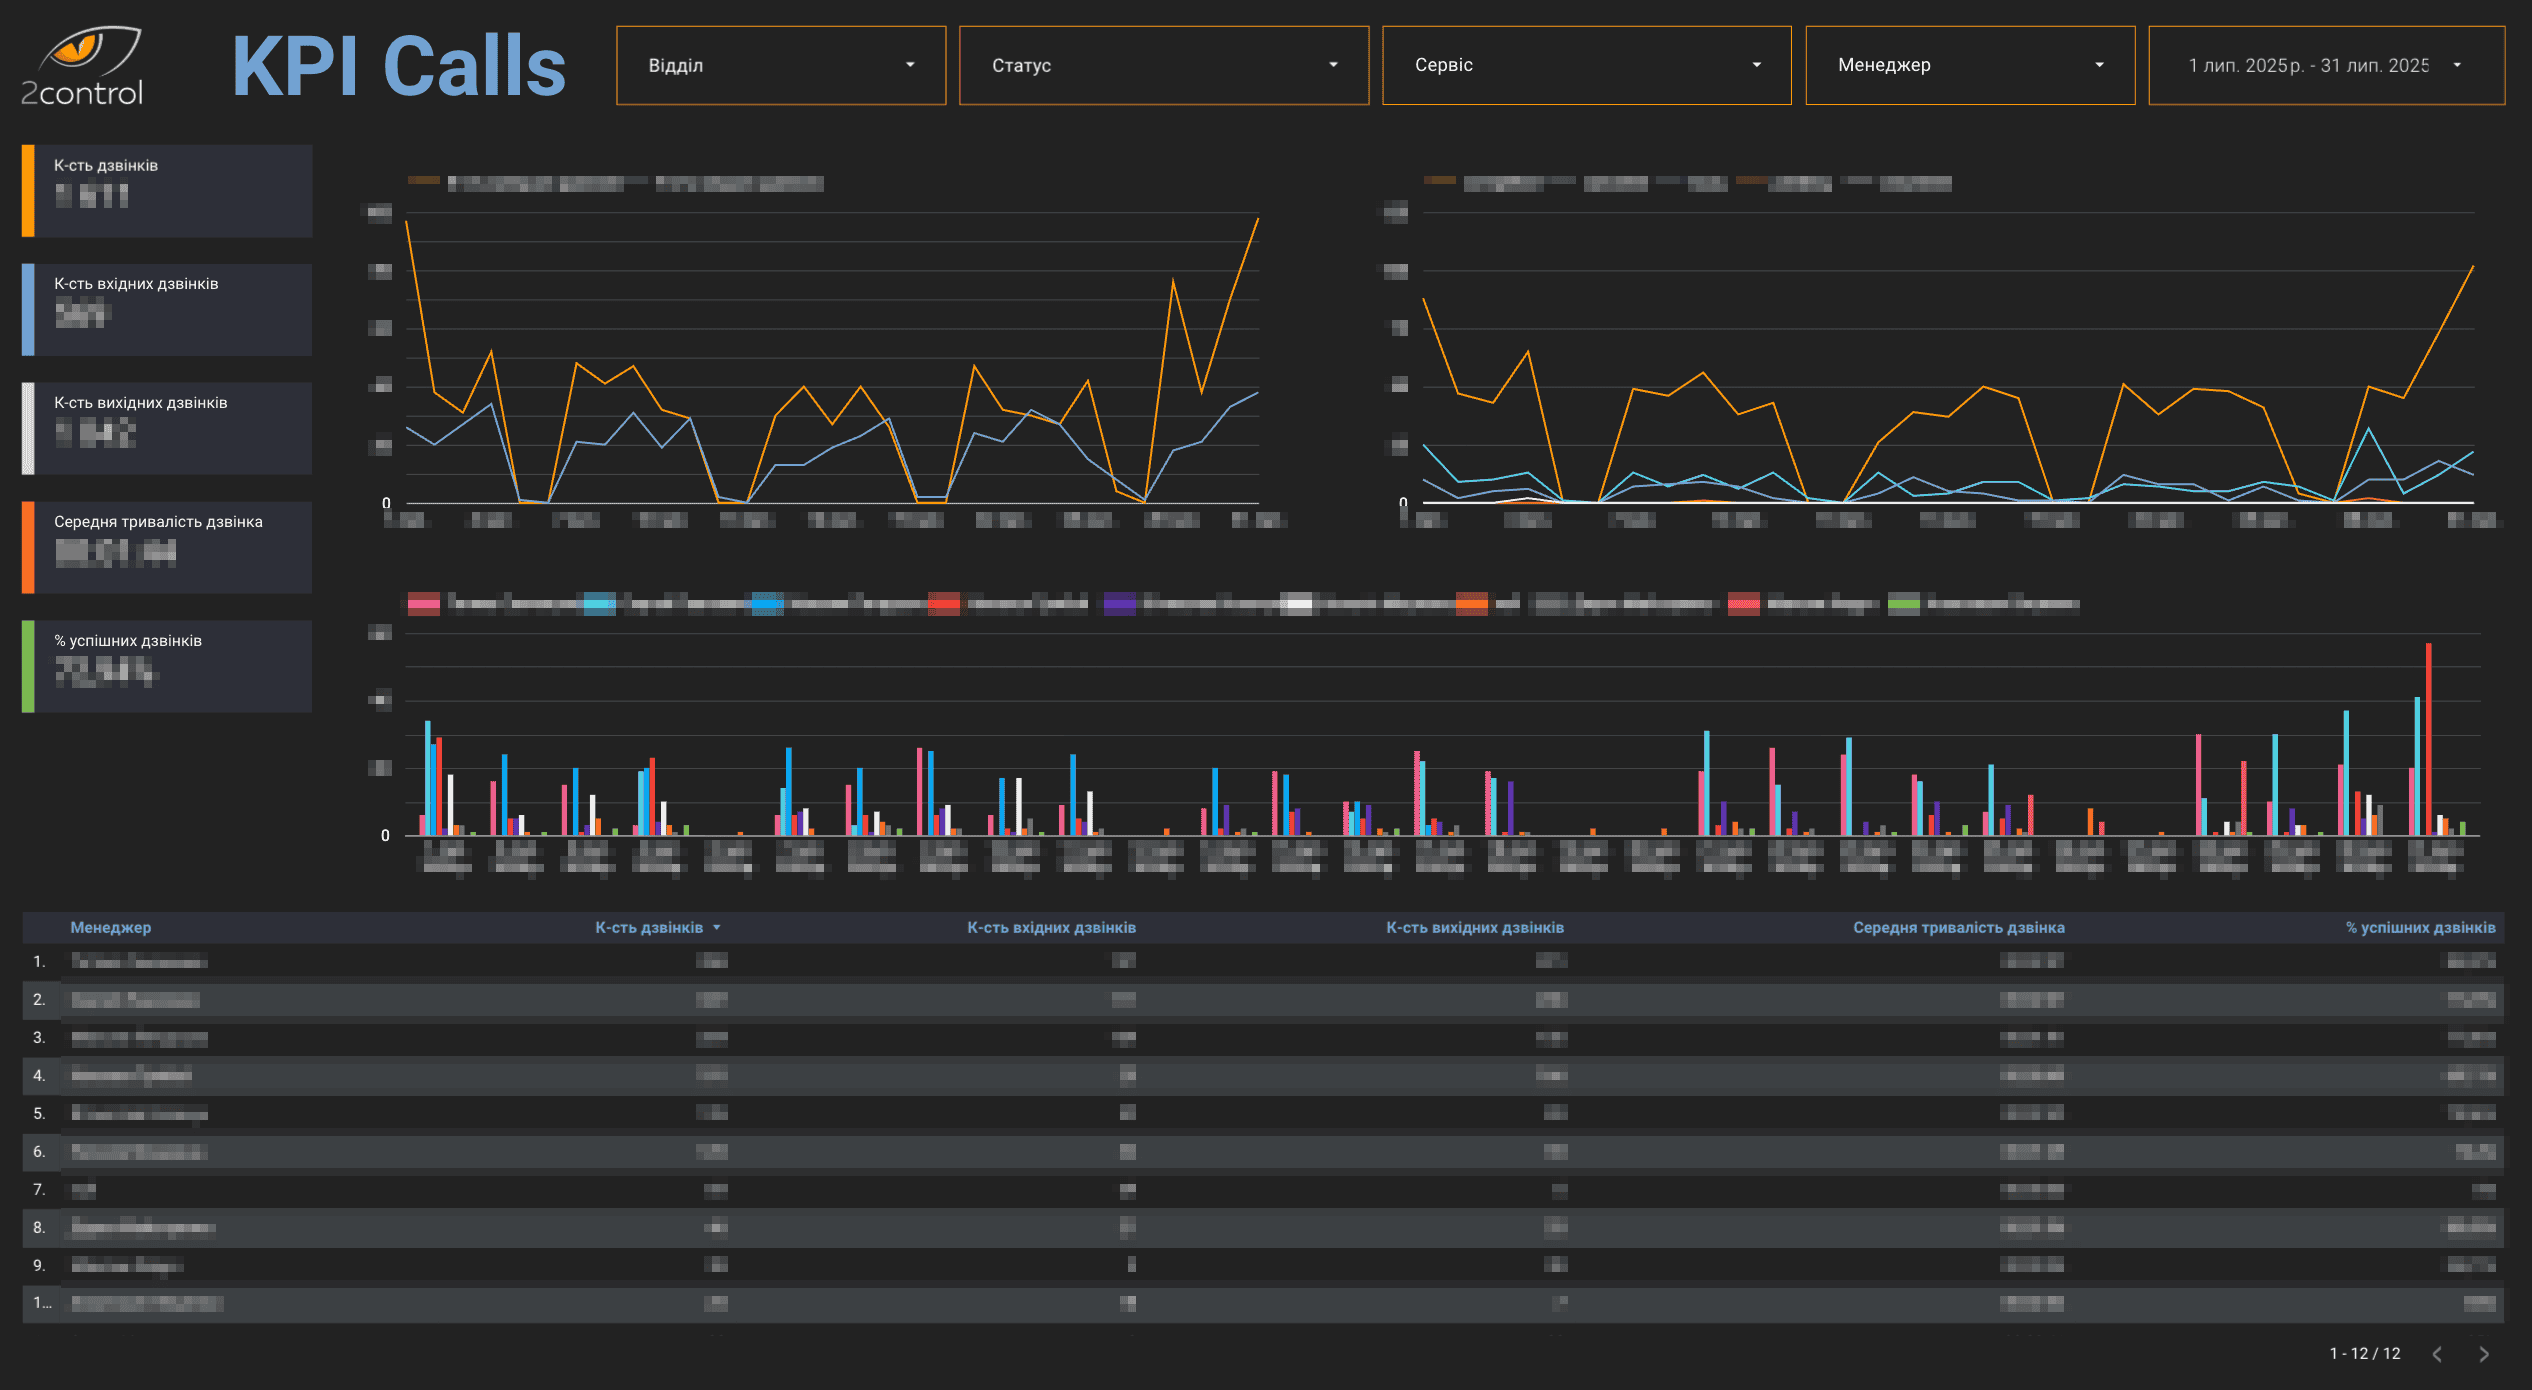
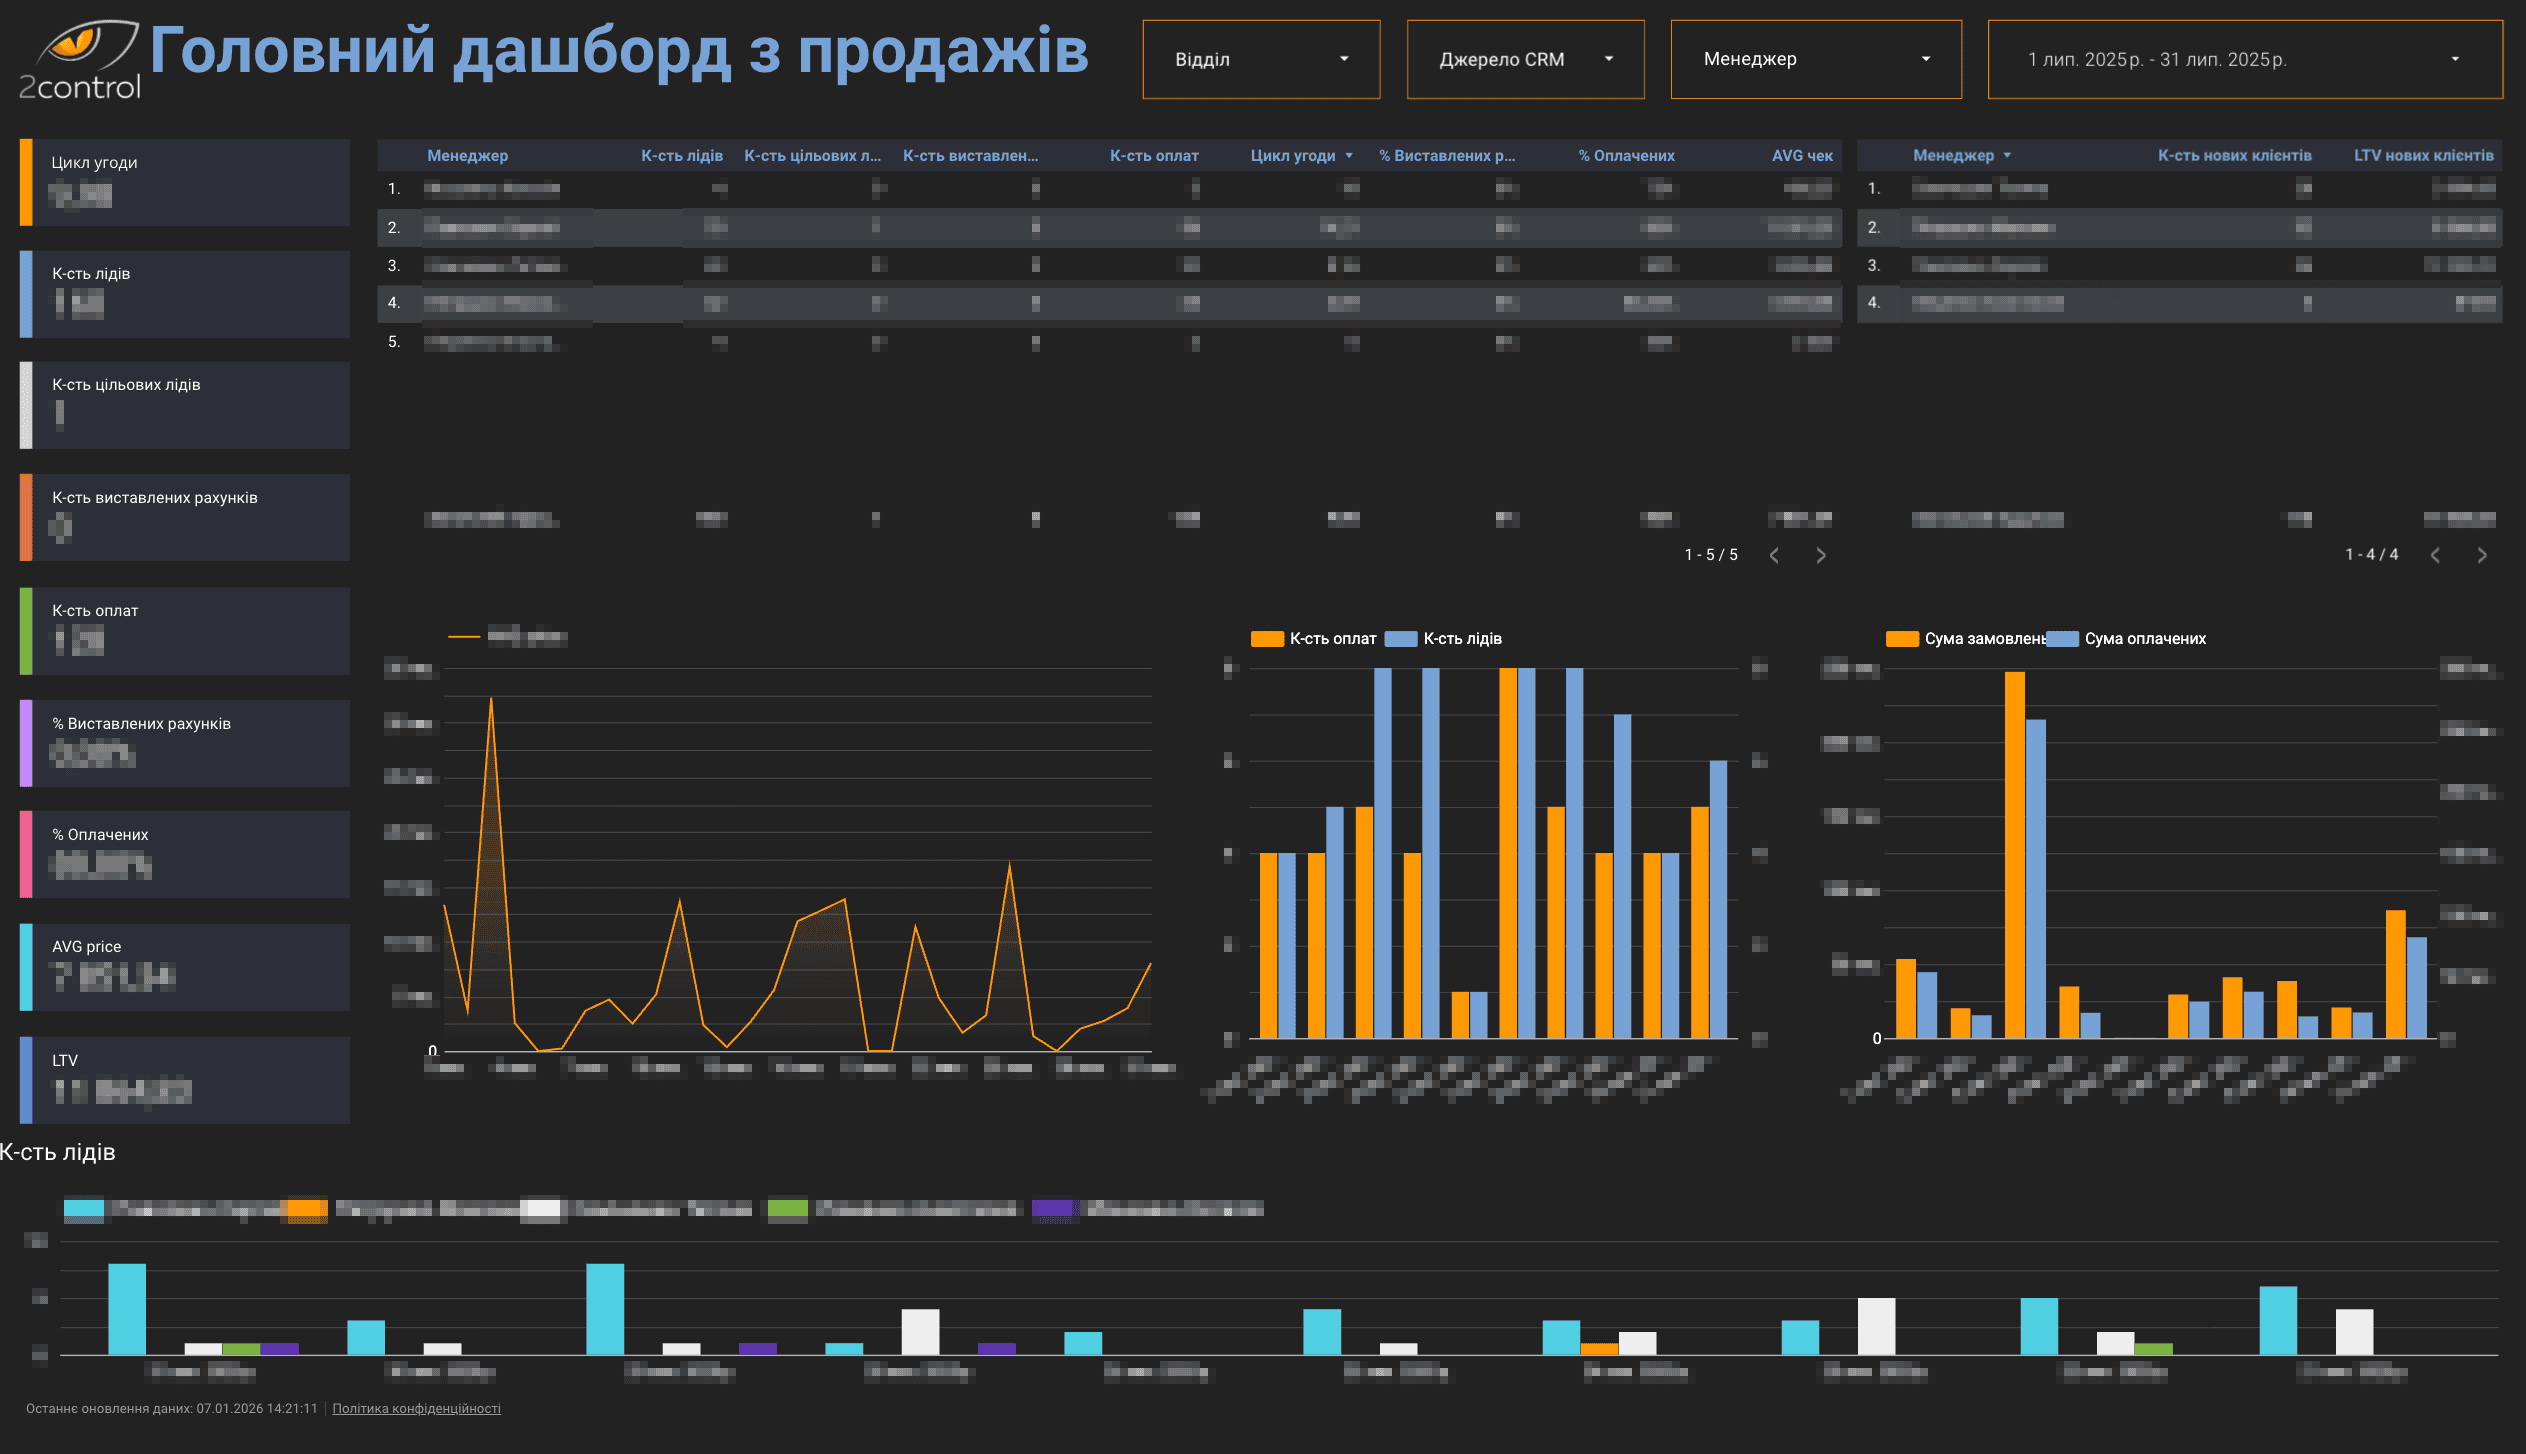 An interactive dashboard with full details of sales indicators by specific managers and departments. It allows you to monitor each conversion stage, sales script operation, manager workload, and telephone conversation efficiency. In addition, there is a clear matrix of product and sub-product sales with LTV of up-sales for each manager.
Practical example
In August, the company made changes to its advertising campaign:
- changed the text of advertisements for the agricultural segment;
- increased the budget for the Google Ads campaign by 15%;
- reduced the budget for less effective channels.
Previously, assessing the effectiveness of these changes would have required manual data collection within two to three weeks. After implementing analytics, the results became visible in two days:
- conversion from advertising to the website increased by 12%;
- lead-to-payment conversion increased by 8%;
- еhe campaign's profitability increased by 20% compared to the previous period.
This allowed the company to quickly respond to the market and scale successful activities.
Impact on the work of managers
CRM was integrated with analytics in such a way that managers were able to control the entire transaction cycle in one interface:
- record leads and prioritize them;
- record actions with clients (calls, correspondence, meetings);
- track conversion for each client;
- see the final results without additional reports.
Changes in internal processes
- Minimizing manual work: previously, managers spent 2–3 hours a day preparing reports. After integration, this work is reduced to a few clicks.
- KPI transparency: the manager immediately sees who is processing which leads and what results they are bringing. 3 Ability to analyze weaknesses: if conversion drops at a certain stage, analytics suggests the reason (unprocessed leads, incorrect data, or problems in advertising).
Effect: increased productivity of managers and control of work quality.
Marketing impact
Before implementing analytics, it was virtually impossible to assess channel performance. Now, a company can:
- compare channels with each other by ROAS and ROMI;
- assess seasonal changes and their impact on sales;
- quickly adjust budgets;
- highlight the most effective campaigns for scaling.
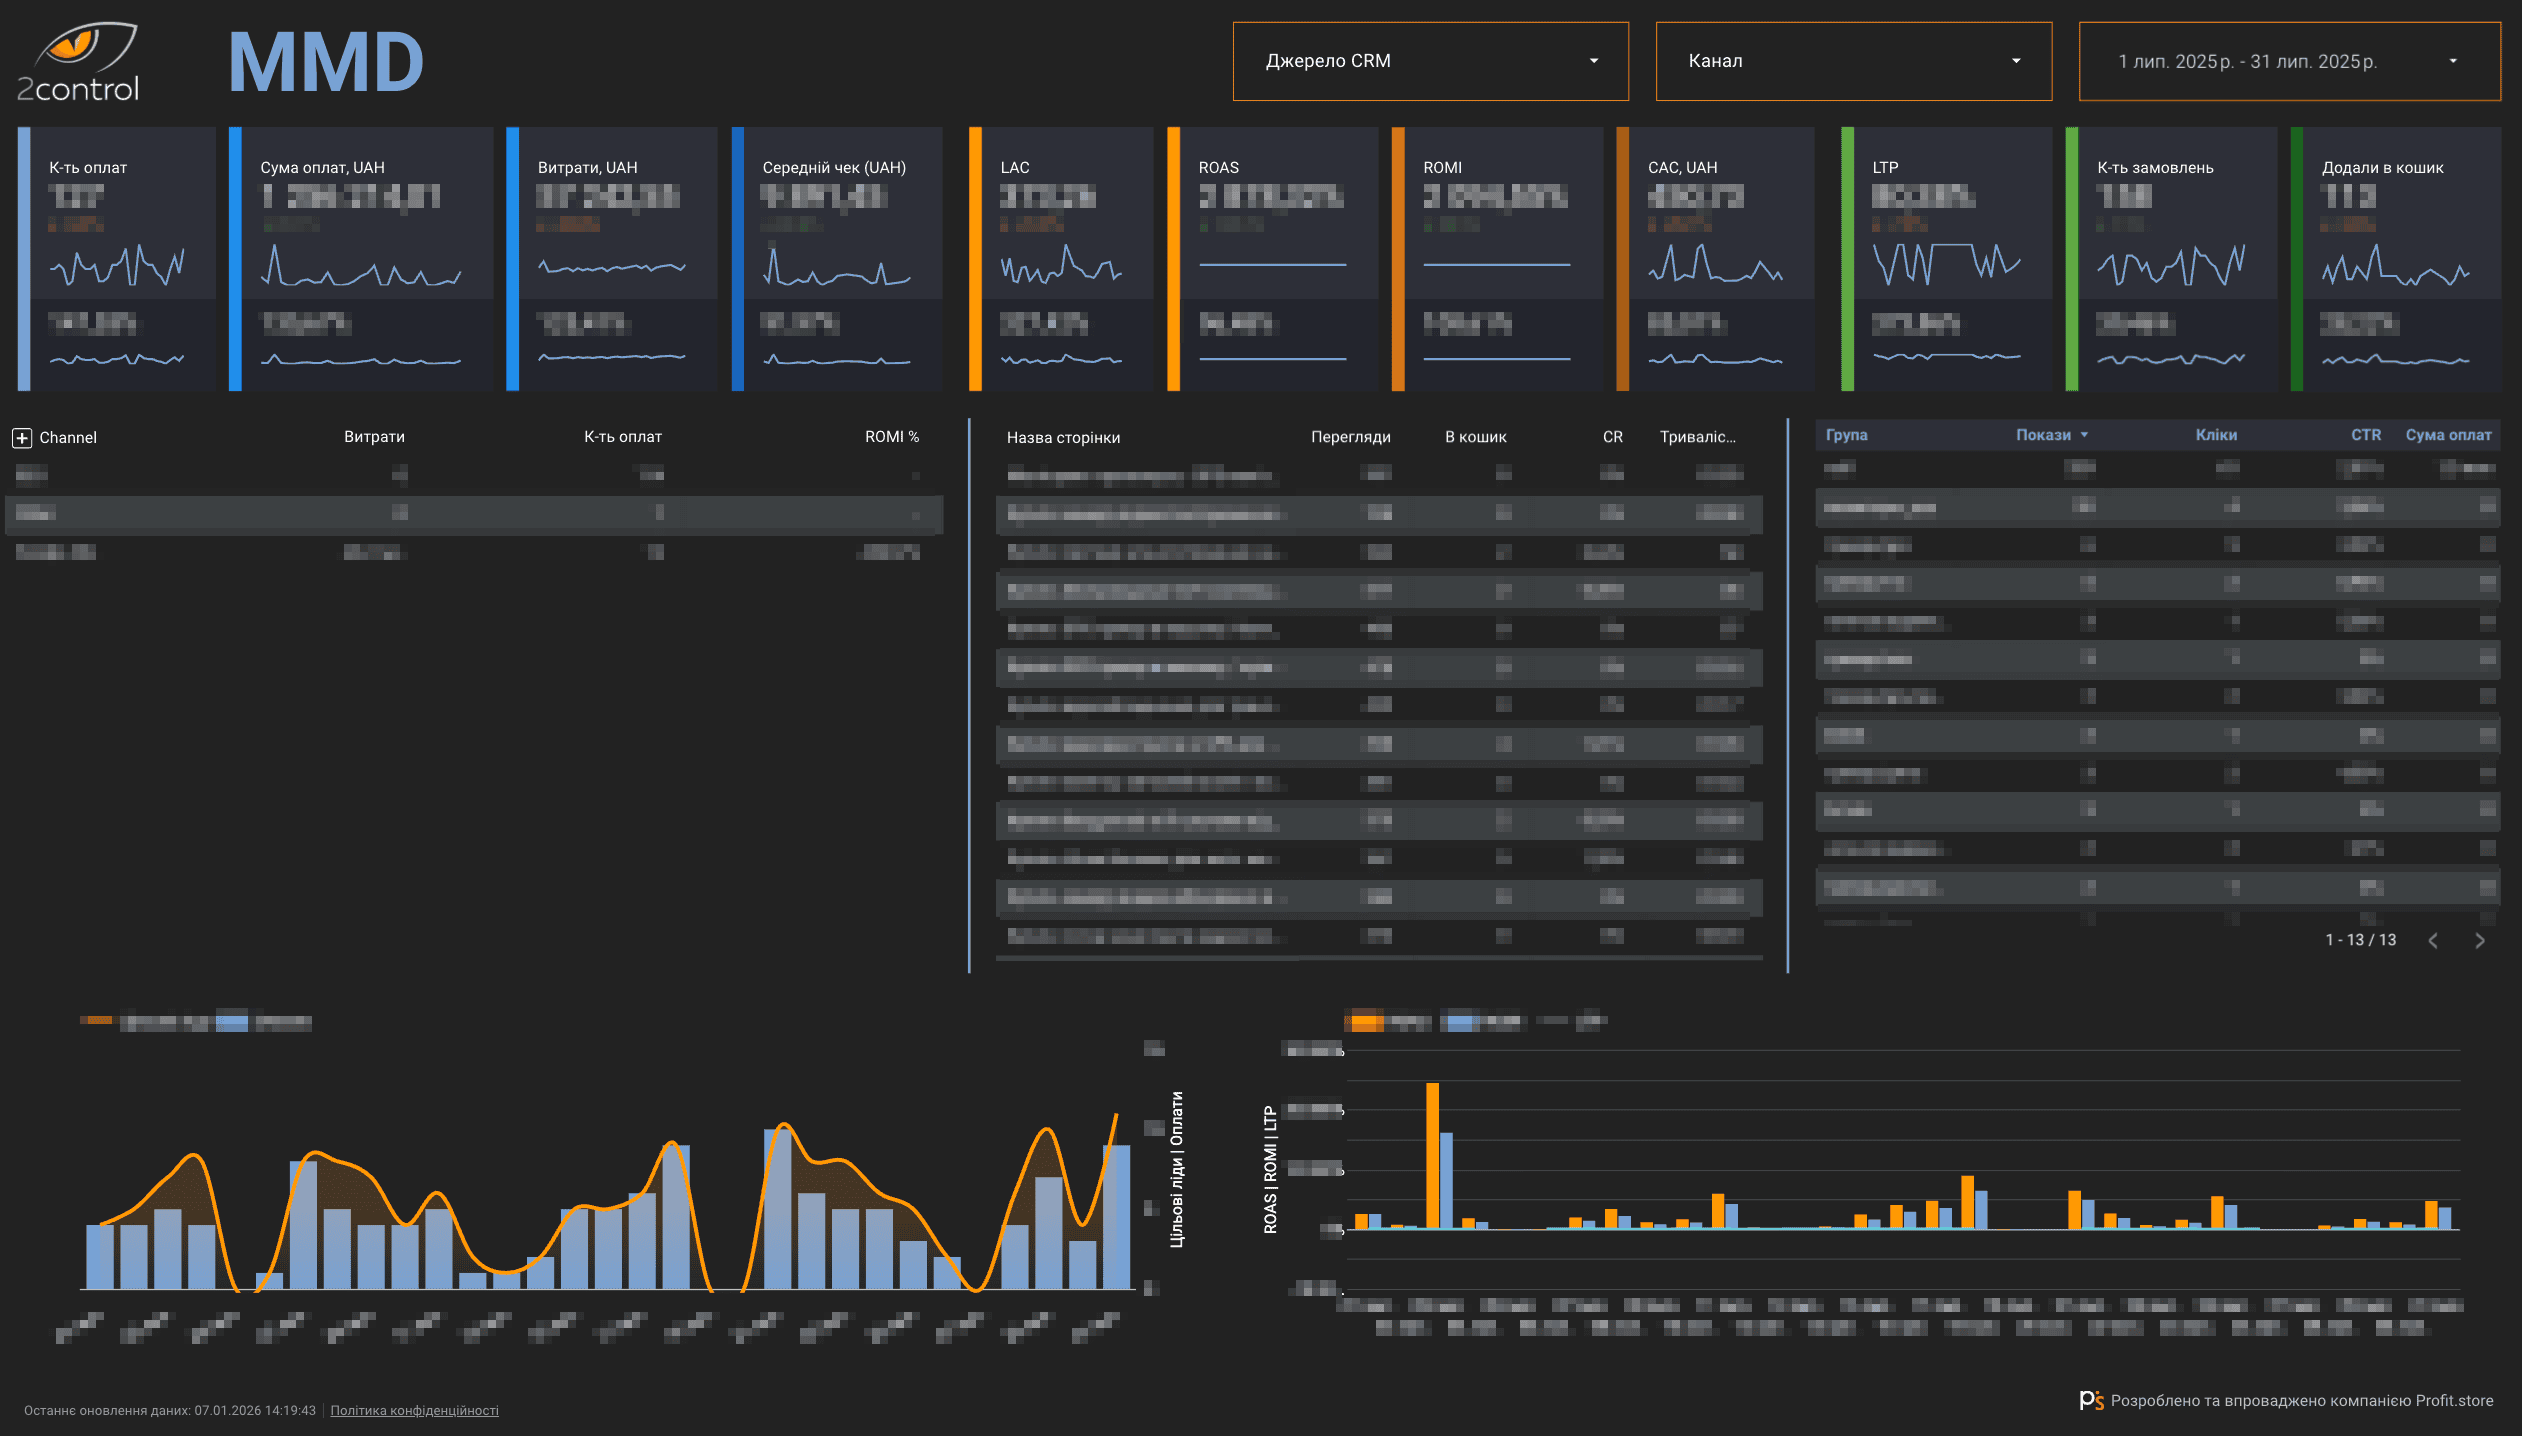 The dashboard is designed to make management decisions based on current data with regular updates. The interactive report has performance indicators for traffic channels, landing pages, and creative visuals. It also allows you to analyze for the selected period and shows the percentage of plan implementation for each key indicator.
Results
- 25% increase in marketing efficiency
With reports, the company can see which channels are working, which leads are converting to sales, and which are just wasted costs. The budget is directed to effective activities, ensuring an increase in ROMI.
- Time savings ≈4080 hours per year
Automating data collection and reporting freed up the team's time for strategic tasks.
- Budget transparency
Now the owner can see where the money is going and can make decisions based on data, not assumptions.
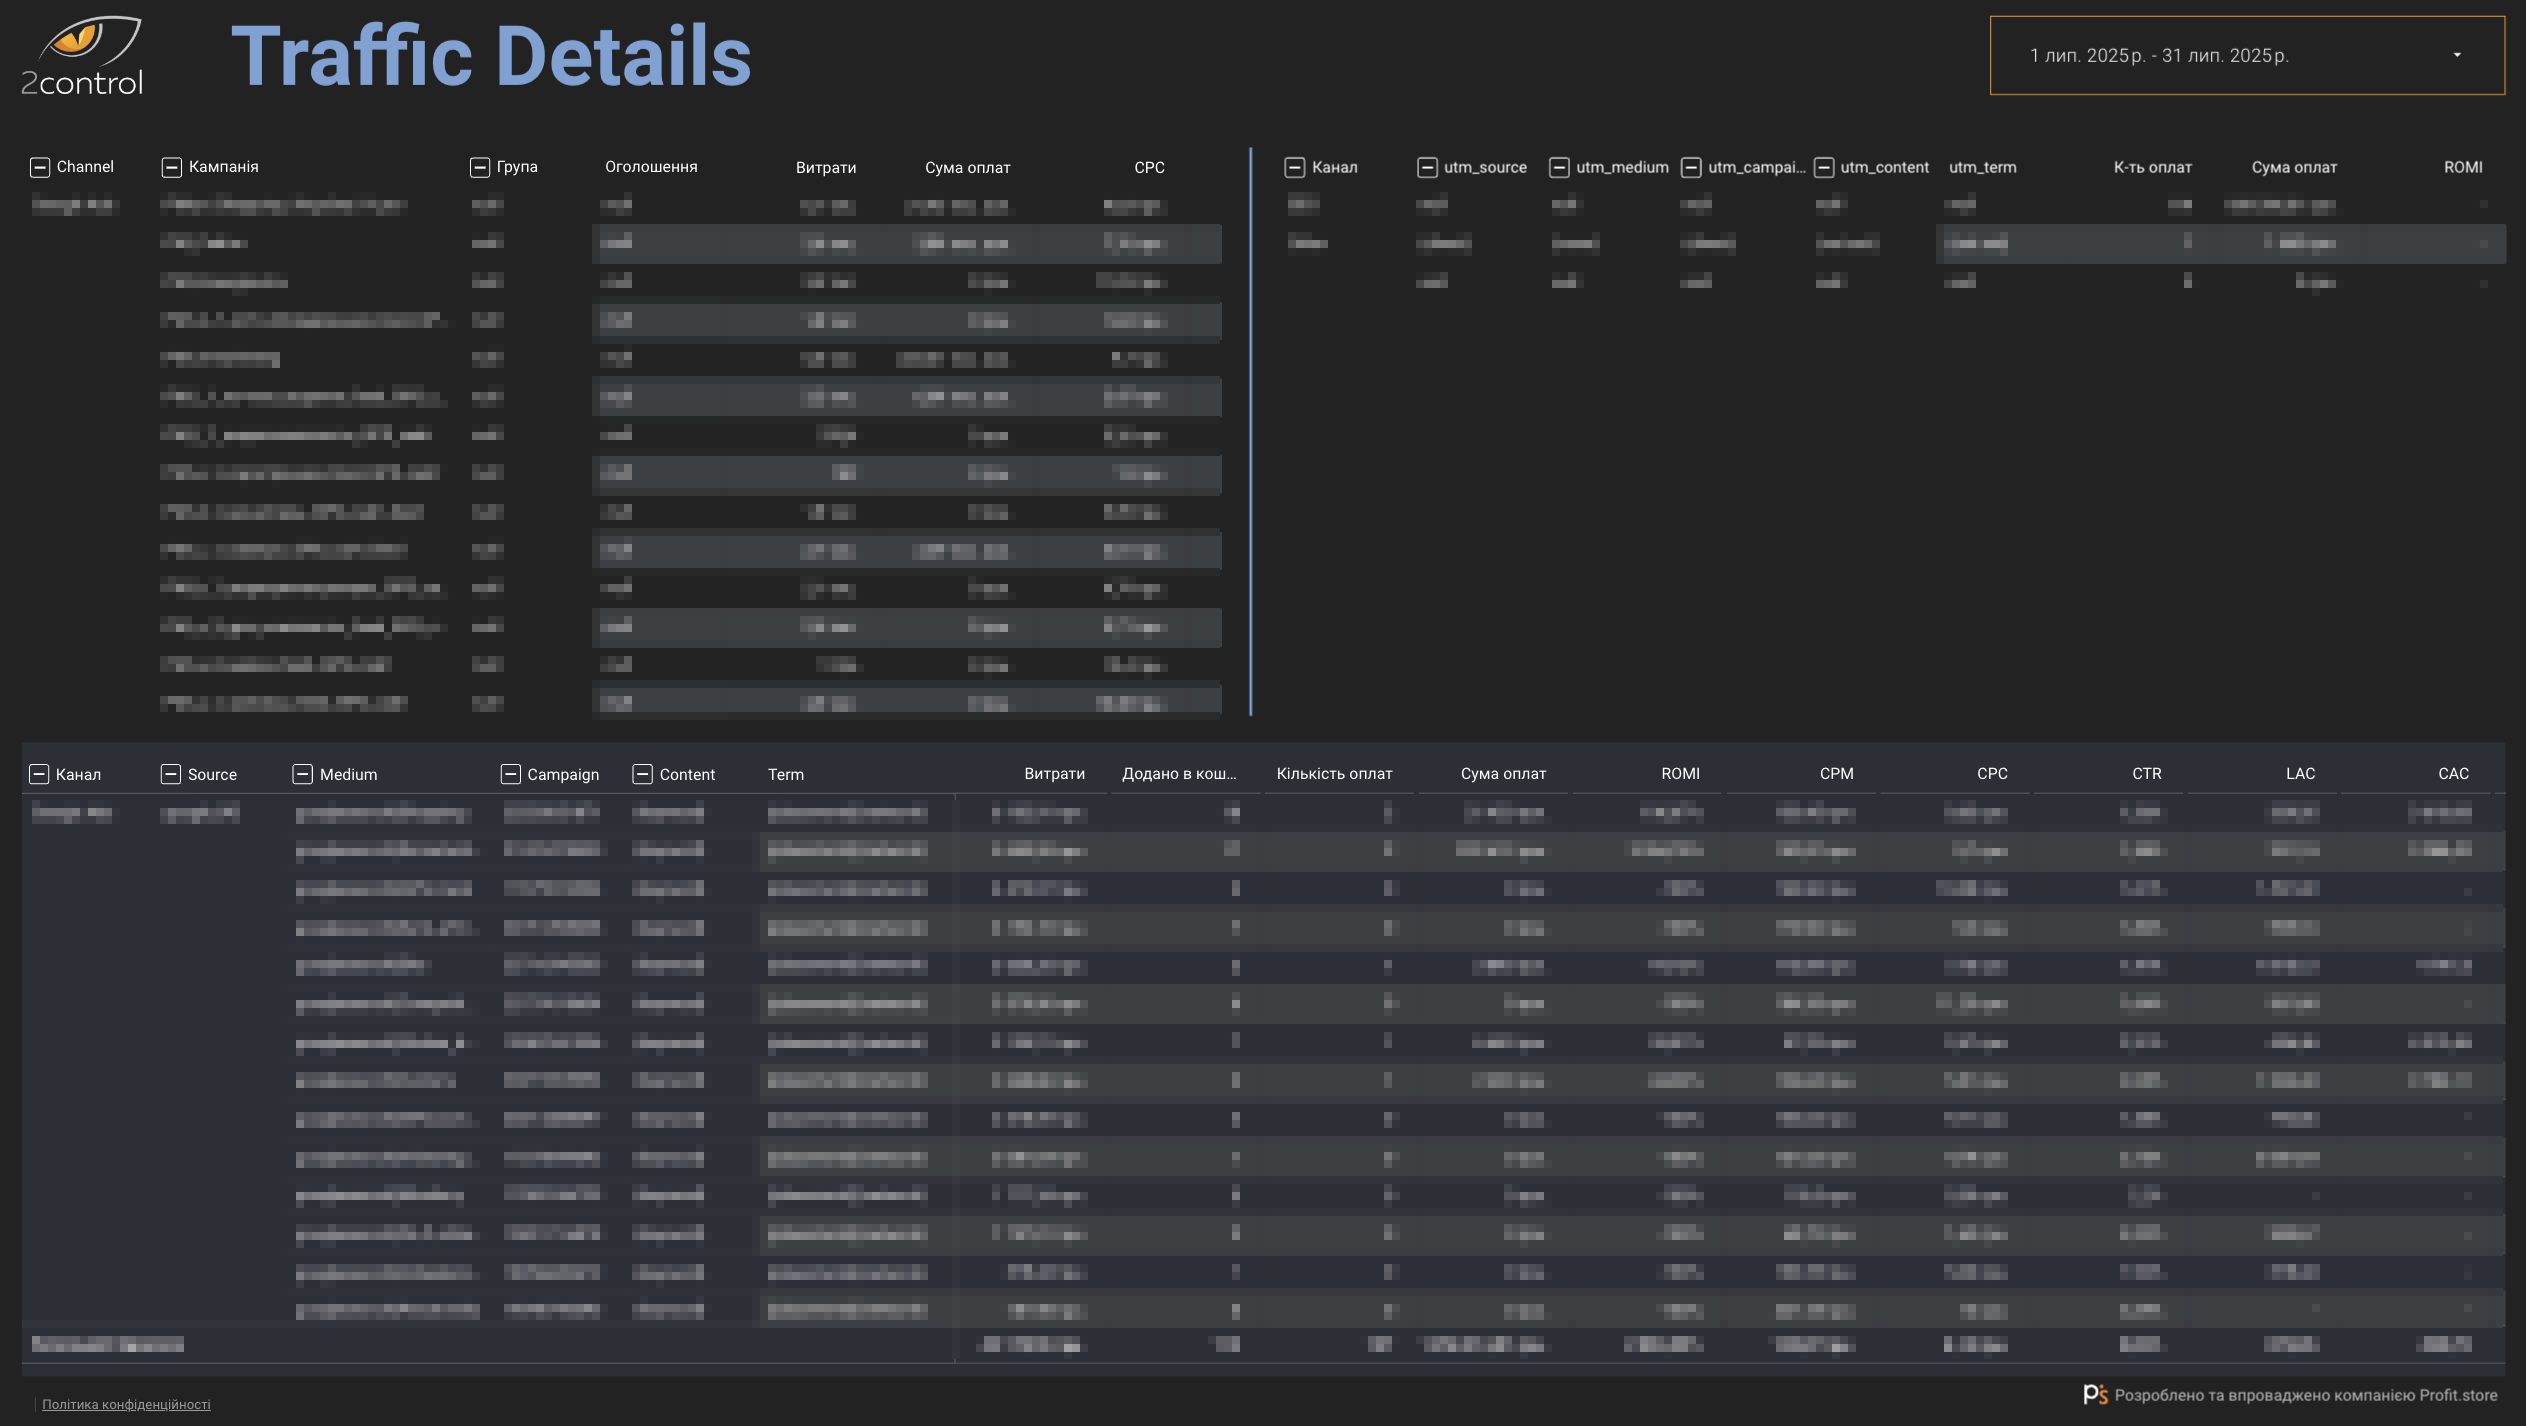 A dashboard that no marketer can live without. It provides maximum detail on each traffic channel, from ad impressions to LTV.
Training and corporate culture changes
Implementing analytics is not just a technical issue. The company has also invested in training the team:
- managers learned to enter data correctly and on time;
- marketers learned to analyze reports and draw conclusions;
- the business owner changed his approach from intuitive management to data-driven.
Why is this important?
Without correctly entered data and a basic culture of working with analytics, even the best system will not be effective. 2Control was able to:
- create a unified accounting logic;
- ensure data accuracy;
- start making decisions based on numbers.
Conclusions
The 2Control case demonstrates:
- CRM without analytics is only half the solution. End-to-end analytics are needed for complete control and optimization.
- Data-driven management allows you to make decisions based on data, not intuition.
- Reporting automation saves the team time and provides transparency to the marketing budget.
- Team training is critical to the correct use of data.
- **CRM integration with analytics **provides full control over sales and the effectiveness of marketing campaigns.
SHARE

OTHER ARTICLES BY THIS AUTHOR
Get the most exciting news first!
Expert articles, interviews with entrepreneurs and CEOs, research, analytics, and service reviews: be up to date with business and technology news and trends. Subscribe to the newsletter!
By clicking “Subscribe” you agree to Privacy Policy and consent using your contact data for newsletter purposes
OR FOLLOW ON:
